Integrated Executive Summary reporting
NAVIGATION Strategy > (select an organization) > (select a starting year) > Add Meeting > Next > Add Reports
NAVIGATION QBR Report Builder > (add or edit a report) > Add > Executive Summary
myITprocess includes the Integrated Executive Summary, a powerful feature designed to simplify the reporting process for MSPs. This tool streamlines data gathering, allows for personalized report customization, and ensures that all reports maintain a consistent, professional look.
By mapping myITprocess organizations to organizations in your other Kaseya modules, this feature allows you to surface data from those organizations in Executive Summary reports.
Configure KaseyaOne Unified Login
KaseyaOne Unified Login must be configured for myITprocess and for all modules for which you would like to generate reports. For myITprocess, refer to Setting up KaseyaOne Unified Login. For the steps for other modules, refer to the module's product documentation.
Map organizations
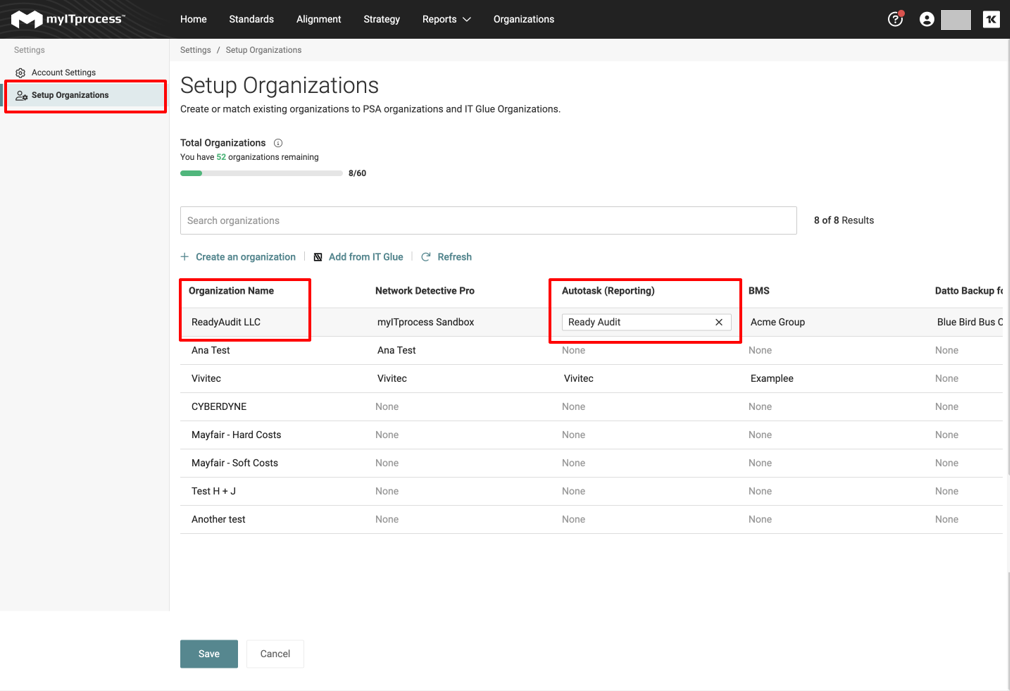
Organization names must be mapped between myITprocess and any modules you would like to run reports for. Modules with KaseyaOne Unified Login configured will show on the Setup Organizations page as available for mapping.
Complete the following steps in myITprocess to map organizations you wish to include in reports:
- Click your profile next to your name.
- Navigate to Account Settings > Setup Organization from the left sidebar.
- Click on a row and select the corresponding organization from the drop-down menu.
- Match an organization for all modules you are including in the report. Scroll the table horizontally to review all available modules.
- Click Save.
You can create a report by adding it to a Strategic Roadmap meeting or through the QBR Report Builder.
Adding an Executive Summary report to your QBR
To add an Executive Summary report to your QBR Report Builder page, complete the following steps:
- Navigate to QBR Report Builder > Create.
- From the Organization drop-down menu, select the appropriate organization. The New report page opens. The page displays three sections - Table of Contents with Details as the first item, Details section in the middle of the page, and the first page of the report in PDF format to the right. The first page has the name of the organization and the report name.
- You can also change the name of this report to make it more appealing for your client and change the order of the reports however you like.
- Under the Table of Contents section, click Add > Executive Summary and select the Module you want to display data from.
The Date Range field appears. Select the period for which you would like to see data for the module. You can select:
- This week
- Last week
- Last 30 days
- Last 90 days
NOTE You can also customize the period.
- Data for the selected module within the selected date range is automatically added to the Executive Summary report. You can combine the executive reports of any kind with other reports like Alignment Report, Budget Report, Microsoft License Usage Report, Notes, Progress Report, Hardware Warranty, and Strategic Roadmap.
- Click Save.
Adding an Executive Summary report to a Strategic Roadmap meeting
To add an Executive Summary report to the Strategic Roadmap meeting, complete the following steps:
- Navigate to Strategy on the menu and select the organization for which you would like to schedule a meeting.
- Click Add Meeting.
- Enter your meeting information in all necessary fields and click Continue.
- Set the agenda for this meeting. At this stage, you can drag and drop recommendations to be discussed and add reports to the agenda.
- Click Add Reports. The following options will be available for customization:
- Module: Select the module from the drop-down menu. Eligible KaseyaOne modules with previously mapped organizations will be available.
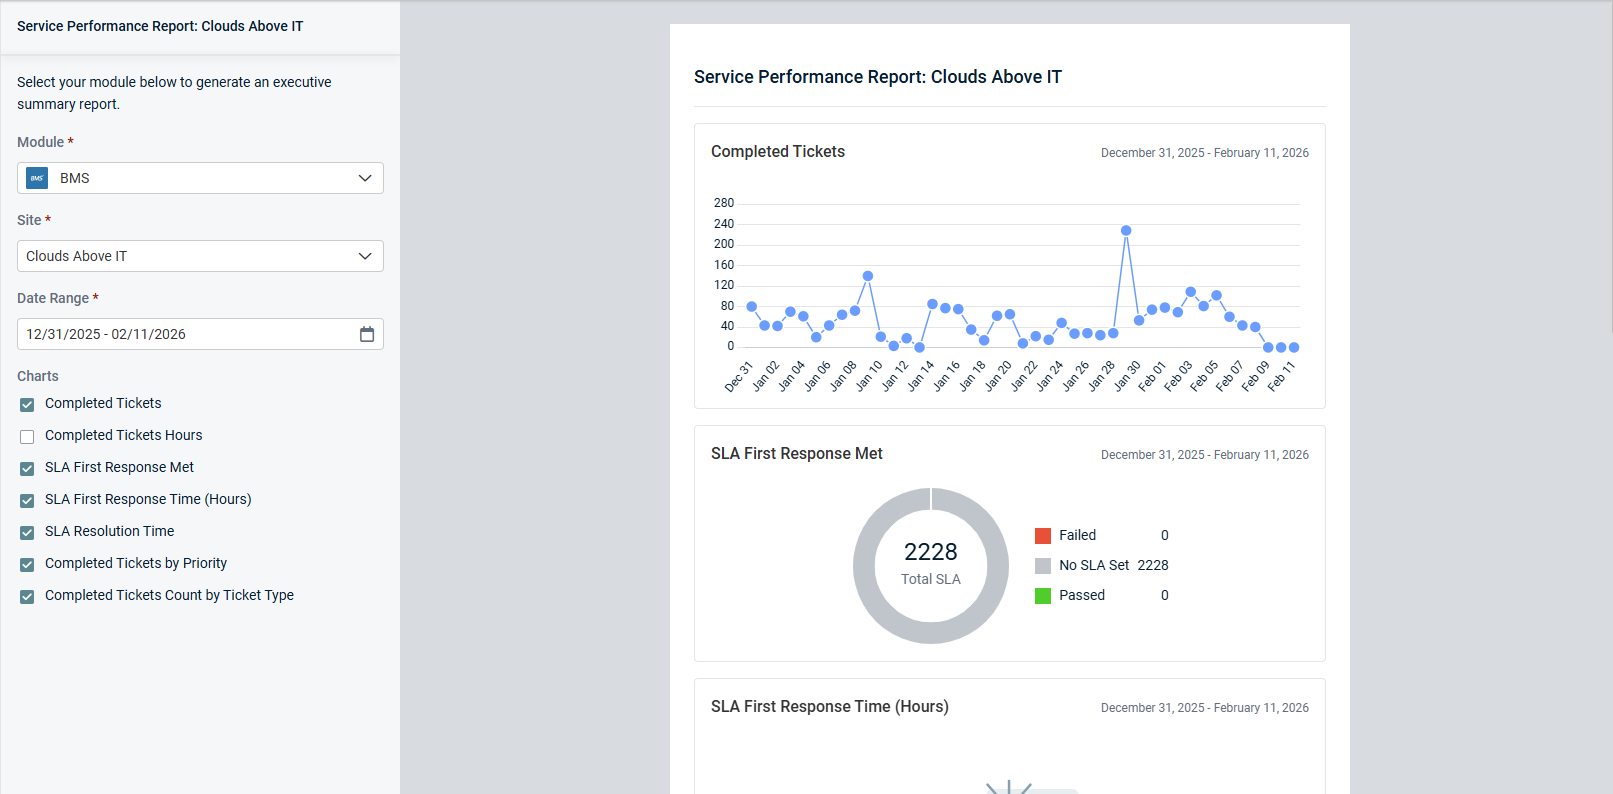
- Site: This field is only available for the following modules: Datto EDR, Antivirus, Network Detective Pro and BMS where site data is synced from the respective module.
- Date Range: Select a date range from the available options. (See step 4 in the previous section.)
- Metrics: Select the metrics you would like to present using the checkboxes under the Date Range section.
- Click Add to include this report to the meeting agenda.
- Repeat steps 5 and 6 to customize and add as many reports as needed.
- If you would like to edit reports post-addition, hover over the item and click the pencil/edit icon.
- When one or more items have been added to the agenda, the Create button will be activated. Clicking this button completes the creation of meeting.
Presenting reports
- Access the strategy menu (hamburger icon) and select the upcoming meeting. Preview reports using Preview to ensure alignment with client expectations and capture feedback effectively.
- Both agenda and Summary PDFs will display comprehensive reporting information.
This section describes the data from all the modules currently supported in Executive Summary reports, organized by module category. It will be updated with every new release.
Autotask
Creating an Executive Summary report for Autotask allows you to showcase high level of service delivery you are providing to your client:
- Completed Tickets Count By Week
- Completed Ticket Hours Worked by Week.
This metric aggregates both billable and non-billable hours worked on any given day a ticket is closed.
- SLA First Response Met
This metric is calculated for completed tickets on any given day where a ticket has an SLA first response configured. A pass or fail SLA first response met is calculated by comparing the SLA first resolution due date/time vs. when the ticket status change date/time that marks this SLA as met. Any completed tickets where no SLA first response has been configured will be excluded from this metric.
- SLA First Response Time (Hours)
- SLA Resolution Time
- Completed Tickets By Priority
- Completed Tickets Count by Ticket Type
If a ticket is completed, re-opened, and closed again on the same day, then this ticket-closing event is only counted once. However, if the ticket is re-opened and completed on a different day, it’ll be re-aggregated in that day’s count.
BMS
- Completed Tickets Count By week
- Completed Tickets Hours Worked By Week
- SLA First Response Met
- SLA First Response Time (Hours)
- SLA Resolution Time
- Completed Tickets by Priority
- Completed Tickets Count by Ticket Type
Datto RMM
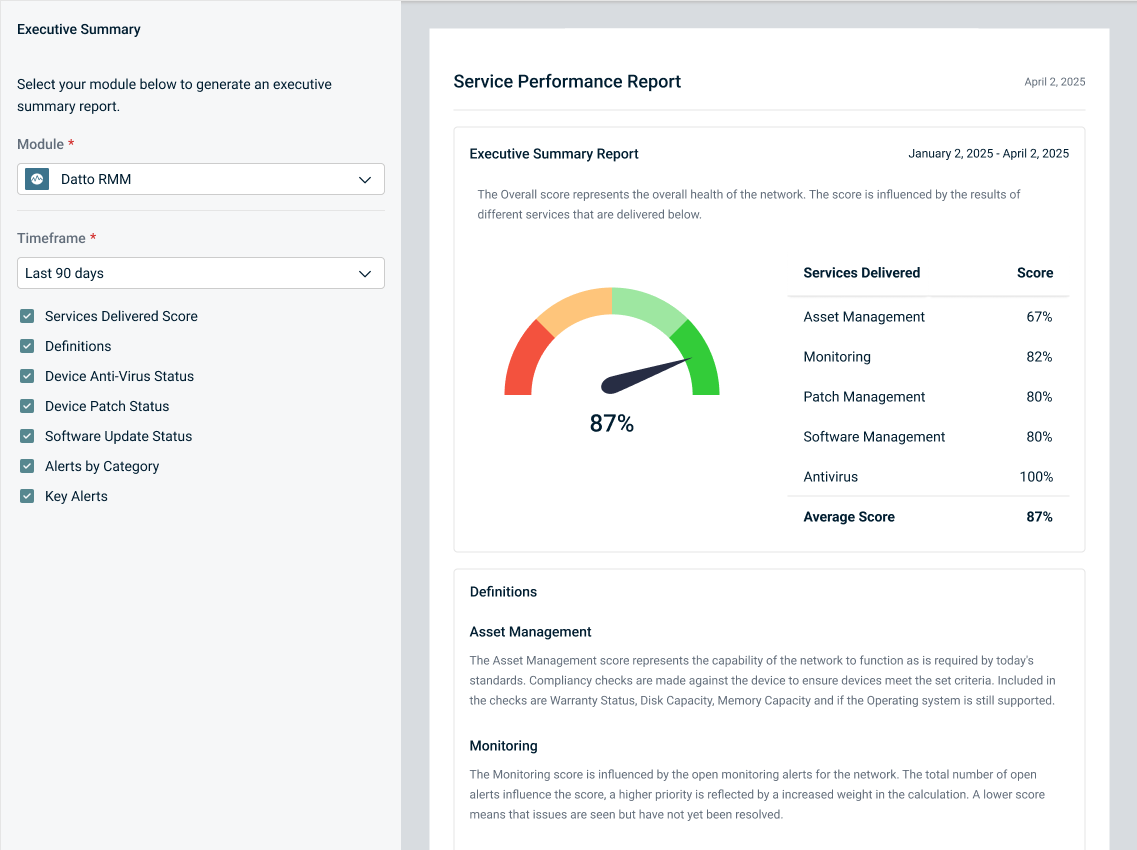
Creating an Executive Summary report for Datto RMM gives visibility into the service delivery level by providing a score based of:
- Services Delivered Score: Percentages highlighting the overall health of the network.
- Definitions: Definitions of the delivered services that constitute the overall score.
- Device Anti-Virus Status: At-a-glance view of device protection.
- Device Patch Status: Quick visibility into patch compliance across your fleet.
- Software Update Status: Clear summary of software compliance.
- Alerts by Category: Visual breakdown of alert trends by type.
- Key Alerts: Highlight critical issues, including ransomware and endpoint security risks.
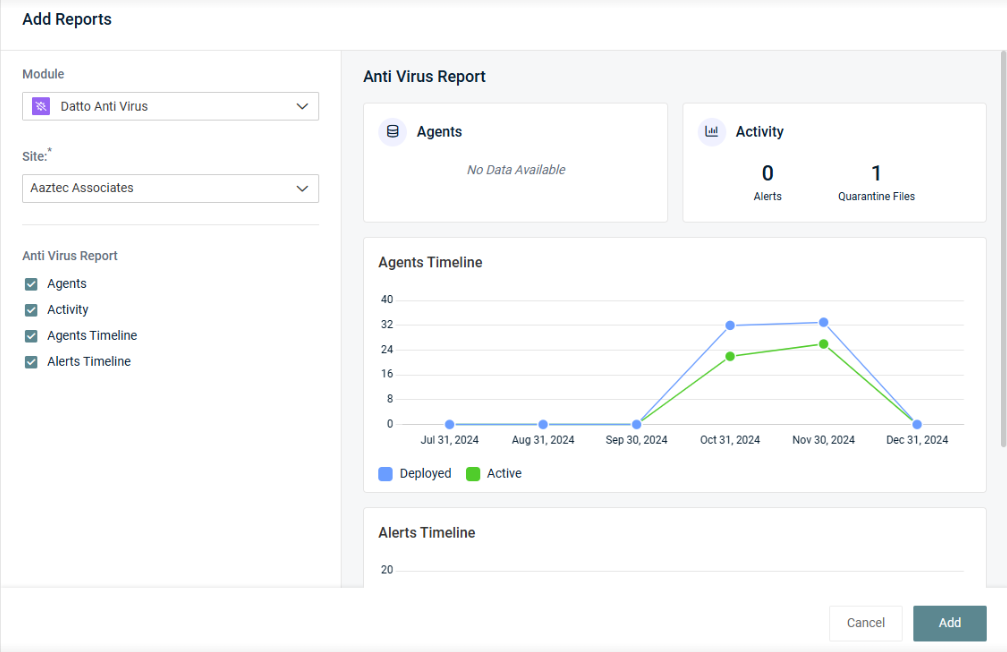
Datto Antivirus
- Agents
- Activity
- Agents Timeline
- Alerts Timeline
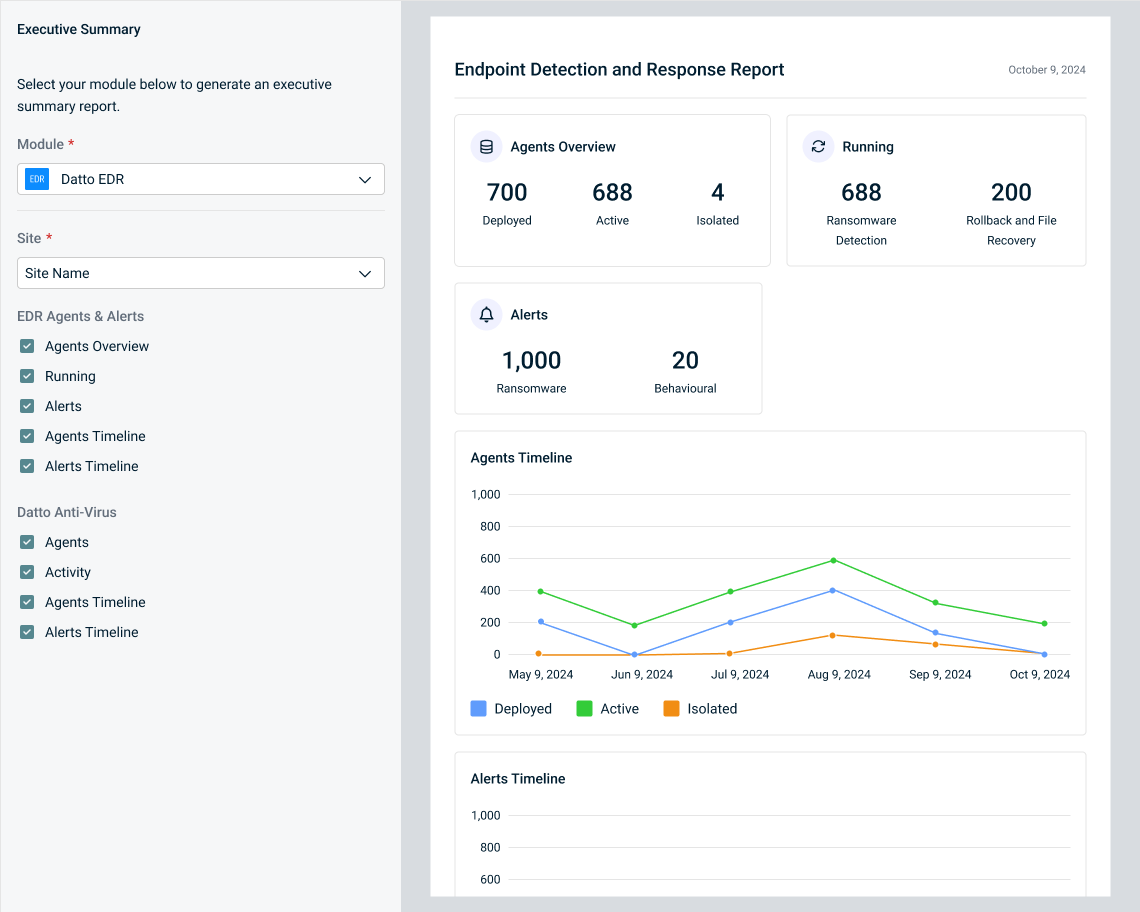
Datto EDR
With Endpoint Detection and Response Report metrics, you can showcase a high level of data protection during your QBR.
- Agents Status Report
- Ransomware Alerts and Behavioral Alerts Report
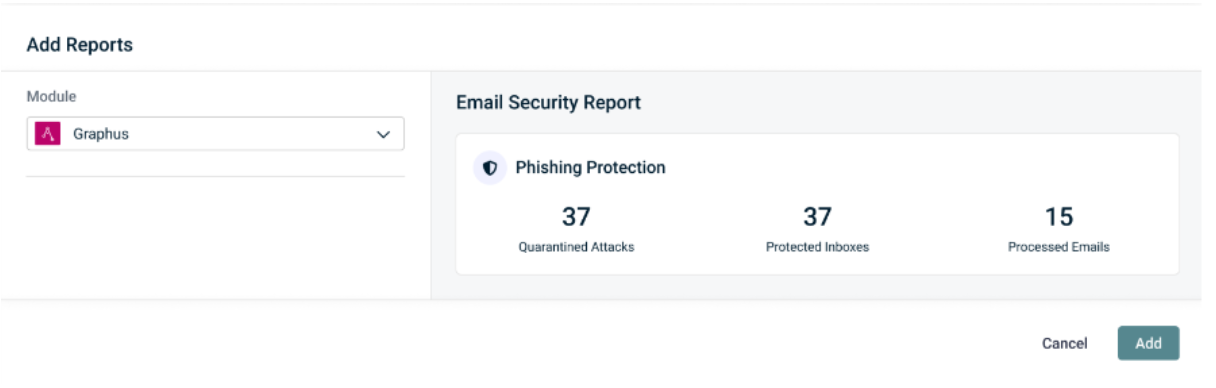
Graphus
We ensure your Phishing Protection status will be a part of your QBR bringing in the following metrics with a seamless integration:
- Quarantined Attacks
- Protected Inboxes
- Processed Emails
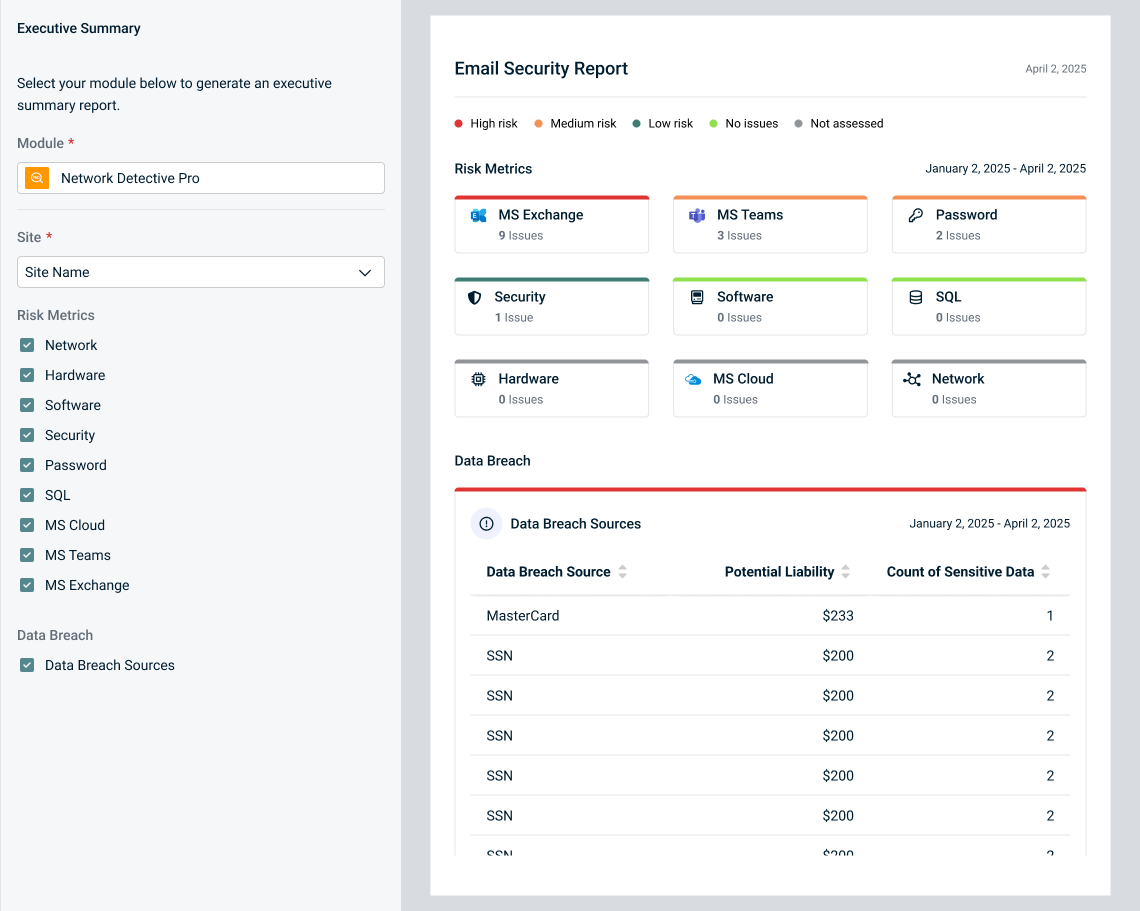
Network Detective Pro
The Network Detective Pro summary provides an overview of the network security issues that were identified within the last 30 days:
- Network: Evaluate the overall health and efficiency of your network infrastructure.
- Hardware: Gain visibility into the performance and status of your hardware components.
- Software: Assess the state of your software applications and identify areas for improvement.
- Security: Monitor and address potential vulnerabilities in your security protocols.
- Password: Ensure the strength and integrity of your password policies.
- SQL: Evaluate the health and performance of your SQL databases.
- MS Cloud: Assess your presence and activities in the Microsoft Cloud environment.
- MS Teams: Gain insights into the utilization and security of Microsoft Teams.
- MS Exchange: Evaluate the health and security of your Microsoft Exchange environment.
- Data Breach Sources: Identify potential sources of data breaches, enabling proactive measures to safeguard your sensitive information.
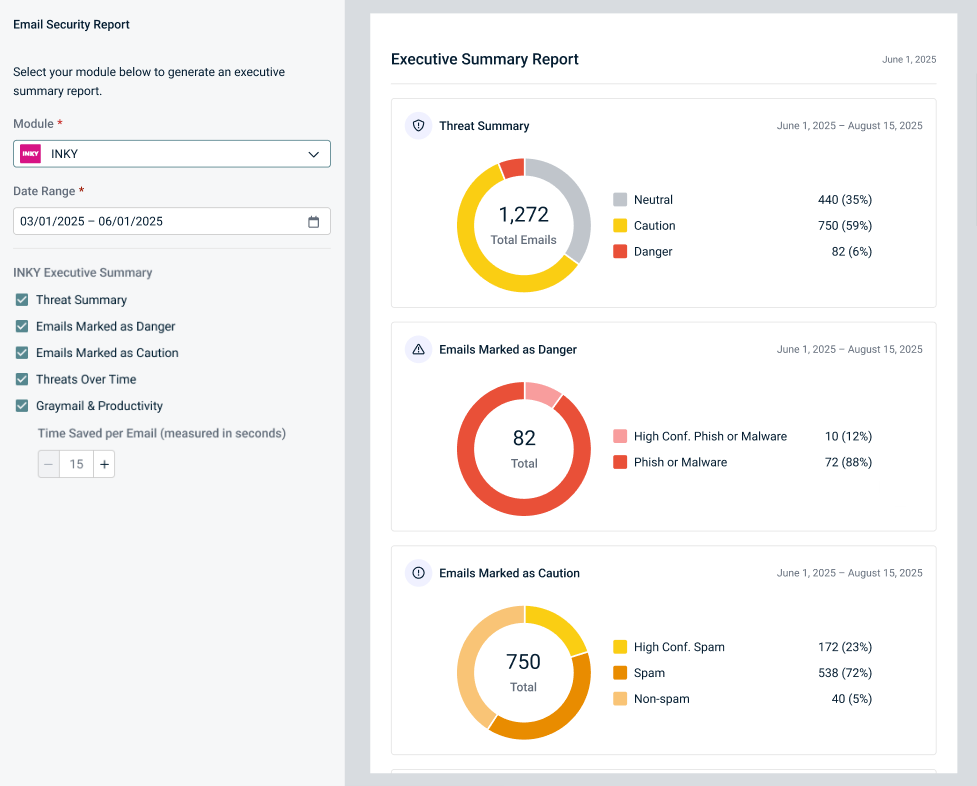
INKY
The following INKY email security and productivity insights allow you to highlight security trends, threat activity, and operational value within the selected date range:
- Threat Summary: A high-level overview of all emails processed by INKY to provide a snapshot of the overall threat landscape across the organization, broken down by classification: Neutral, Caution, and Danger.
- Emails Marked as Danger: The total number of emails INKY flagged as Danger, broken down by high-confidence and regular phishing and malware.
- Emails Marked as Caution: The total number of emails INKY flagged as Caution, broken down by high-confidence spam, spam, and non-spam.
- Threats Over Time: A time-series view showing the bi-monthly volume of Danger and Caution emails, allowing you to identify spikes in malicious activity, track trends, and correlate threat surges with specific events or time periods.
- Graymail & Productivity: The total number of messages remediated across all users, alongside the estimated hours saved. This estimation is calculated by multiplying the remediated message count by a configurable per-email time savings value (defaulting to 15 seconds).
Executive Summary reports include a large amount of data from the variety of backup tools to ensure your clients that their data is safe.
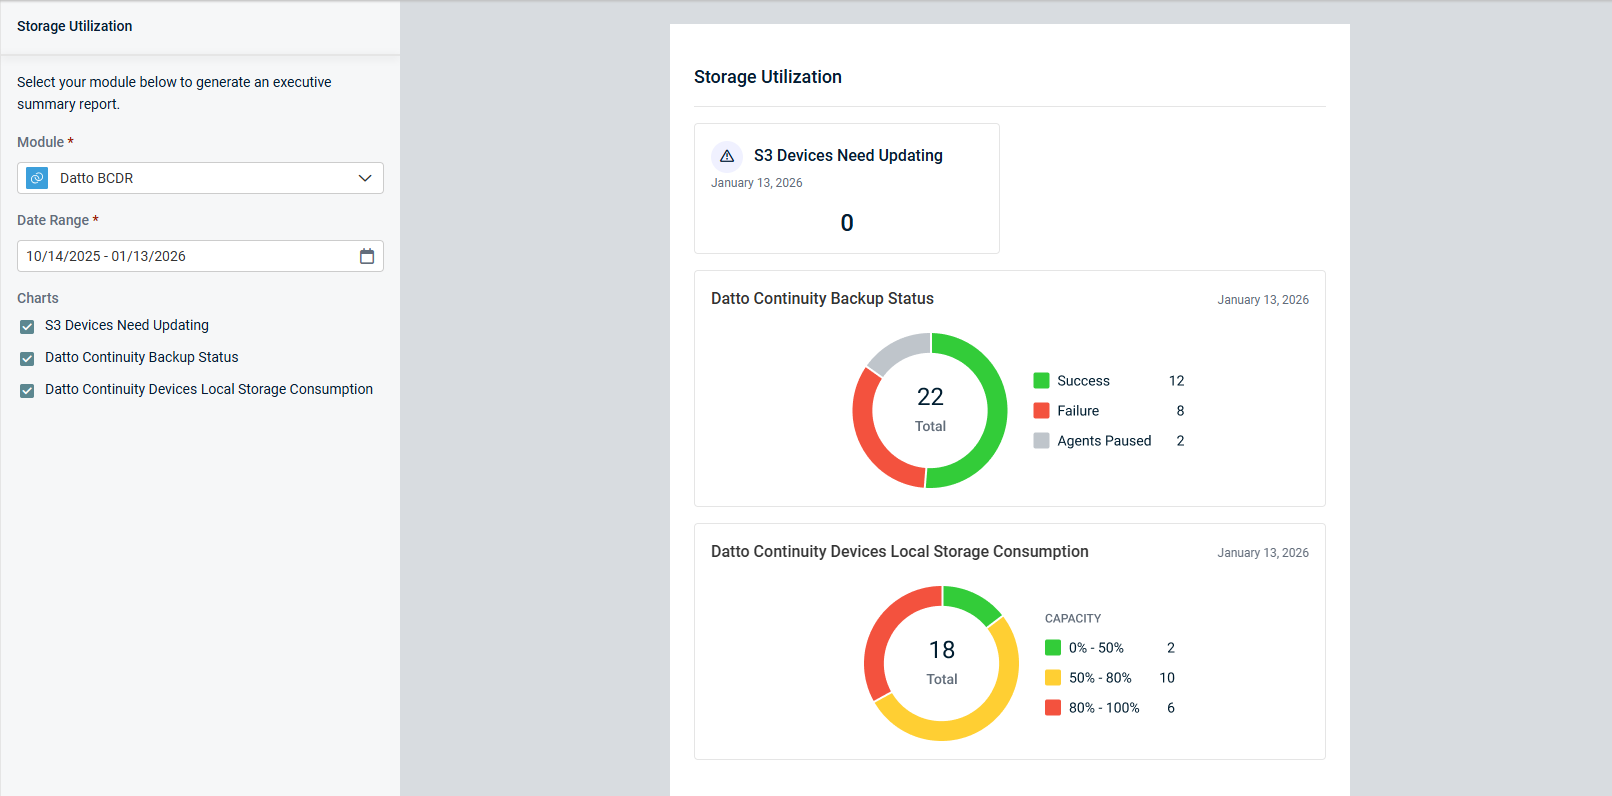
Datto BCDR
- S3 Devices Need Updating: Stay up to date on devices requiring updates, ensuring optimal performance and security.
- Datto Continuity Backup Status: Get visibility into your backup status, ensuring the continuous protection of your critical data.
- Datto Continuity Devices Local Storage Consumption: Understand how local storage is utilized across devices, allowing for efficient resource management.
Backup health metrics for specific products
- Datto Backup for Microsoft Azure: Gain insights into the health of your Microsoft Azure backups, ensuring the integrity and availability of your cloud-based data.
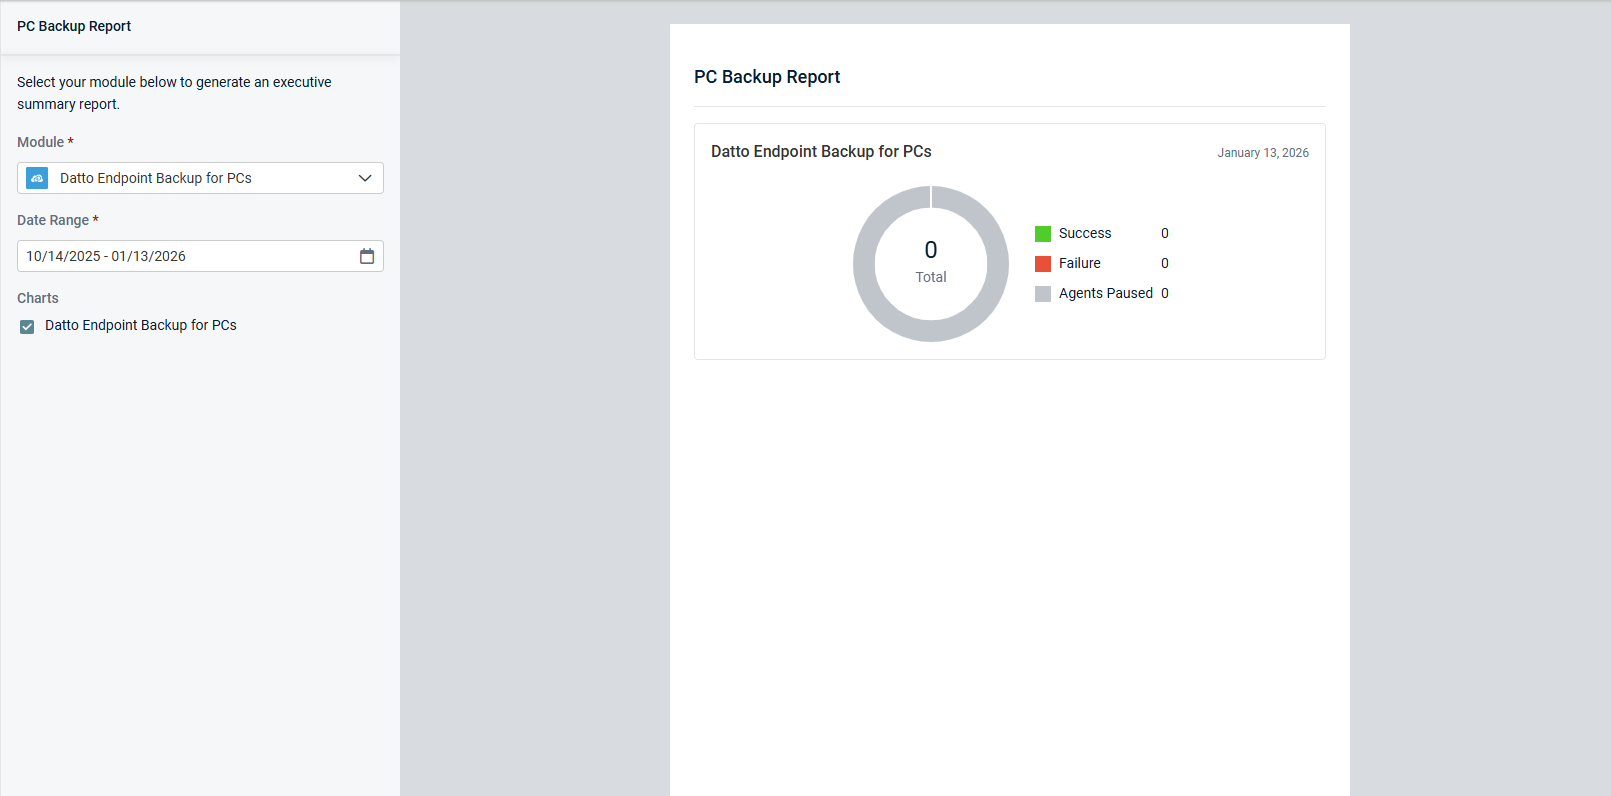
- Datto Endpoint Backup for PCs: Track the backup health of your PC endpoints, ensuring crucial data is securely backed up for quick recovery.
- Datto Endpoint Backup for Servers: Monitor the backup status of your servers, ensuring continuous data protection and minimizing downtime.
Datto Workplace
- End User Workstation: Access counts of used desktop licenses and servers, providing valuable metrics for licensing management.
- Storage Usage: With total used gigabytes displayed prominently, users can effortlessly track their storage consumption. For metered plans, available and used gigabytes are also conveniently provided.
- Device Version Status: Alerts users to devices requiring updates, ensuring system security and performance.
- Device Connection Status: Information on device connectivity, enabling proactive troubleshooting and maintenance.
- Alert Status: Critical alerts and total alerts created daily are presented on a timeline, empowering users to address issues promptly.
- PII Summary: Statistics on personally identifiable information (PII) file types stored across the organization, facilitating compliance and data security efforts.
Datto File Protection
- Usage summary
- Servers
- Storage Usage
- Backup Success Summary
- Device Version Status
- Alert Status
Datto SaaS Protection
The report consists of the following metrics:
- Backup Success Rate
- Failed Backup Rate
- Backup Status
- Backup Success Rate Timeline
- Backup Coverage
- Protected Assets
- Endpoint Backup Health
Spanning for Google Workspace
- Users
- Storage
Spanning for Salesforce
- Subscription
- Licenses purchased
- Users
Spanning for Microsoft 365
This report includes information on the backup status of the data stored in Microsoft 365 on:
- Users
- SharePoint
- Microsoft Teams
- Storage


