Using the Unified Backup Dashboard
NAVIGATION Backup Dashboard
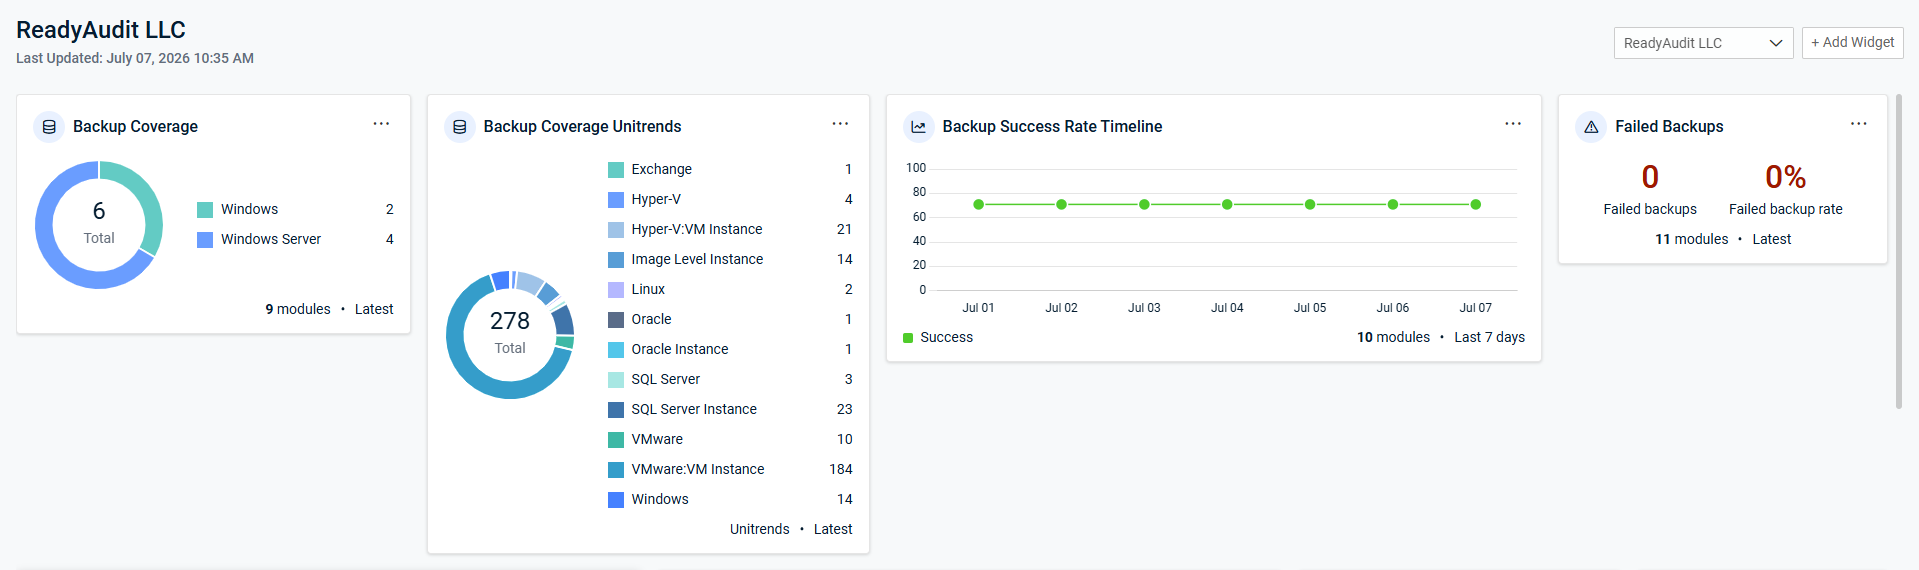
The Unified Backup Dashboard offers a centralized view of data across Kaseya backup modules, enabling vCIOs and IT leaders to monitor, assess, and report from a single interface. The dashboard consolidates data from multiple backup solutions to provide near real-time visibility, faster issue resolution, and simplified audit and compliance reporting. Clear, actionable insights support quarterly business reviews (QBRs) and help ensure consistent data protection without manual effort.
This feature enables you to create organization-specific dashboards by adding, arranging, and customizing widgets to meet a client's monitoring and reporting needs. The dashboard helps identify service gaps and provides early warning of potential backup issues, allowing for proactive monitoring and faster issue resolution.
NOTE Data on the Unified Backup Dashboard is currently synced once a day.
Integrated backup modules
Data from the following Kaseya modules is available to sync to the Unified Backup Dashboard in myITprocess:
- Datto Backup for Microsoft Azure
- Datto BCDR
- Datto Endpoint Backup
- Datto Endpoint Backup for Servers
- Datto File Protection
- Datto SaaS Protection
- Endpoint Backup (v2)
- Spanning for Google Workspace
- Spanning for Microsoft 365
- Spanning for Salesforce
- Unitrends
Prerequisites
KaseyaOne Unified Login
Enable Log In with KaseyaOne must be turned on in the myITprocess account and for all modules you would like to generate data for in the Unified Backup Dashboard. Refer to Enabling Log In with KaseyaOne in this Help system and the per-module instructions in the KaseyaOne Help system.
Organization/site mapping
Determine which Kaseya backup modules and which organizations you want to be able to see backup data for. For a list of the modules that can be integrated with this feature, refer to Integrated backup modules.
Only modules with Enable Log In with KaseyaOne turned on are available for mapping on the Setup Organizations page in myITprocess. To generate backup data for an organization in a certain module, it must be mapped to its matching myITprocess organization on the Setup Organizations page.
For details, refer to Performing organization mapping.
Accessing the dashboard
Click Backup Dashboard in the top navigation menu. The Unified Backup Dashboard is set up individually for each organization.
To view a different organization's dashboard and metrics, use the organization drop-down menu in the upper-right corner of the page. You can either select an organization from the list or search for a specific organization using the Search bar.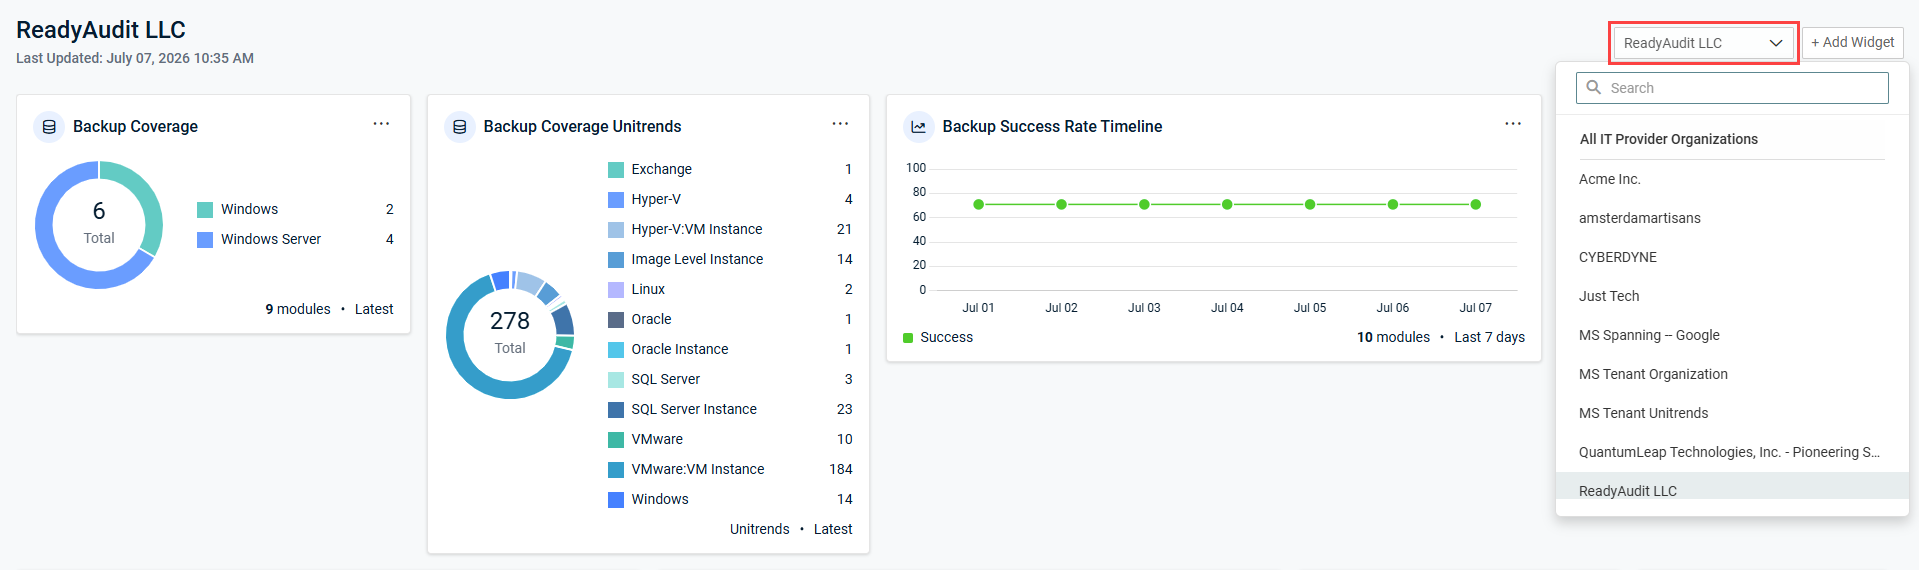
The date and time of the last data synchronization is displayed in the upper-left corner of the page.
Dashboard widgets
The Unified Backup Dashboard widgets are organized into three categories: Alerts, Asset Health, and Backup Rates.
NOTE A widget displays a No Data state instead of metrics until at least one selected source module reports data.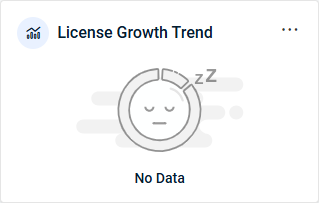
For a list of the Kaseya backup modules that can be integrated with this feature, refer to Integrated backup modules.
Widget fields and customization options
You can view and edit widget settings after adding a widget to the dashboard. Available fields vary slightly by widget type.
| Field | Description |
|---|---|
| Title | By default, the widget title matches the name of the widget. To change the title, edit the widget and enter a new title in the Title field. |
| Type of widget | This field identifies the original type of widget. Referencing this field may be useful if the widget title has been customized, as the title may no longer reflect the widget type. To view the widget type, edit the widget and check this field. The widget type cannot be changed. |
| Module | Available modules vary by widget. Refer to the Reported by (Modules) column in Dashboard widgets. For the widgets that can reflect combined data from more than one backup module, all available modules are selected by default. To include or exclude a specific module, edit the widget and select or clear its checkbox in the Modules drop-down menu. |
| Timeframe |
For widgets with an editable Timeframe field, the following options are available:
For widgets without an editable Timeframe field, Latest is selected by default. |
| Asset type |
This field refers to the category of IT resource or equipment (asset) that a backup pertains to, such as a server, workstation, VM, or cloud endpoint. The asset options are synced from the mapped organization in the integrated Kaseya backup modules. For the widgets with an asset type field, all synced assets are selected by default. To include or exclude a specific asset, edit the widget and select or clear its checkbox in the Asset type drop-down menu. |
The following table shows which fields are editable for each widget type. To learn how to edit these fields in the widgets you add to the dashboard, refer to Edit a widget.
| Widget | Title | Module(s) | Timeframe | Asset type |
|---|---|---|---|---|
| Endpoint Backup Health Trend | ✓ | ✓ | ✓ | ✓ |
| Backup Success Rate Timeline | ✓ | ✓ | ||
| Alerts Trend | ✓ | N/A | ||
| License Growth Trend | ✓ | N/A | ||
| Storage Used | ✓ | N/A | ||
| Endpoint Backup Health | These widgets show a current snapshot of the most recently synchronized data rather than data over a selected time period (Latest). | ✓ | ||
| Protected Assets | ✓ | |||
| Backup Status | ✓ | |||
| Backup Success Rate | ✓ | |||
| Failed Backups | ✓ | |||
| Backup Coverage | N/A | |||
| License Coverage | N/A |
How to...
When you add, remove, or edit widgets on the Unified Backup Dashboard, you are customizing the dashboard for the currently selected organization.
 Add a widget
- In the top navigation menu, click Backup Dashboard.
- From the organization drop-down menu in the upper-right corner of the page, select an organization.
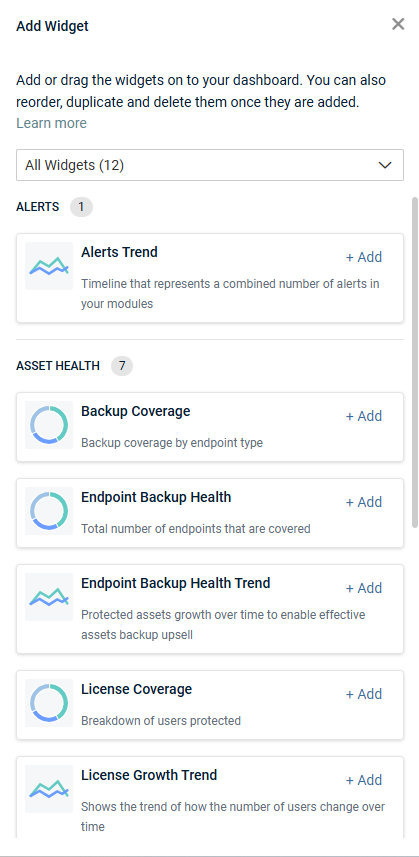
- Click Add Widget in the upper-right corner of the page. The Add Widget pane opens on the right side of the page, listing all available widgets grouped by category. Refer to Dashboard widgets.
- Add a widget to the dashboard using either of the following methods:
- Drag a widget tile from the pane and drop it anywhere on the dashboard to position it where you want it to appear.
- Click Add on a widget tile to add it to the lower-left corner of the dashboard. You can then reposition it as needed by dragging and dropping it within the dashboard.
Edit a widget
For each widget, you can edit the title and the reflected module data. For some widgets, you can edit the reflected assets and/or time period. Refer to Widget fields and customization options.
- In the top navigation menu, click Backup Dashboard.
- From the organization drop-down menu in the upper-right corner of the page, select an organization.
- From the three-dot menu (...) in the upper-right corner of the widget you want to edit, select Edit.
- Edit the available fields as needed.
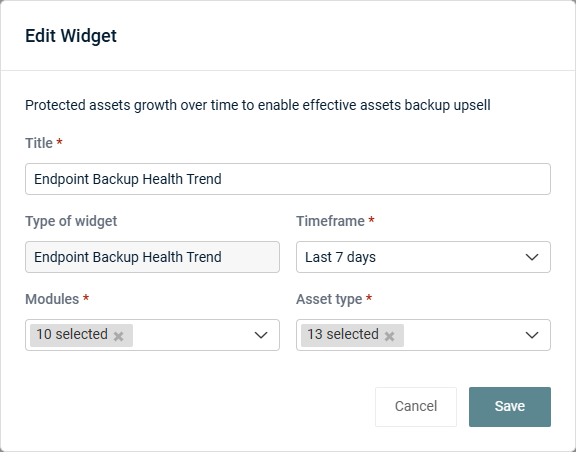
- Click Save.
Duplicate a widget
- In the top navigation menu, click Backup Dashboard.
- From the organization drop-down menu in the upper-right corner of the page, select an organization.
- From the three-dot menu (...) in the upper-right corner of the widget you want to duplicate, select Duplicate.
A copy of the widget appears next to the original. The copy has the same settings as the original widget but is named [Original Widget Name] Copy. To customize the name, edit the Title field of the copy. Refer to Edit a widget.
Delete a widget
- In the top navigation menu, click Backup Dashboard.
- From the organization drop-down menu in the upper-right corner of the page, select an organization.
- From the three-dot menu (...) in the upper-right corner of the widget you want to delete, select Delete.
- In the confirmation pop-up window, click OK to execute the deletion.
NOTE Deleting a widget removes it from the dashboard view only. The widget remains available in the Add Widget pane, so you can add it back at any time.
Backup data in QBR reports and meeting agendas
myITprocess also gives you the option to reflect Kaseya backup module data in Integrated Executive Summary reports. Once your backup module organizations are mapped to myITprocess organizations, refer to the following sections of Integrated Executive Summary reporting to learn how to surface backup data in reports for your clients:


